
Overview
The project explored TSA claims filed from 2002 through 2025. It used R to clean and summarize the data and then answer practical questions about the most common claim types, where incidents occurred, how much claimants requested, and how cases were resolved.
Problem
Large public datasets often contain inconsistent categories, missing values, and extreme outliers. A straightforward summary could be misleading without cleaning, clear denominators, and a visualization strategy suited to skewed claim amounts.
Context & role
I completed the analysis as a database-programming case study. I prepared the dataset, conducted the R analysis, selected visualizations, and wrote the summary report.
Approach & workflow
- Inspect and clean. Review column types, missing values, category labels, and unusable records.
- Summarize categories. Count claim types and incident sites.
- Cross-tabulate. Compare the dominant claim type within each site.
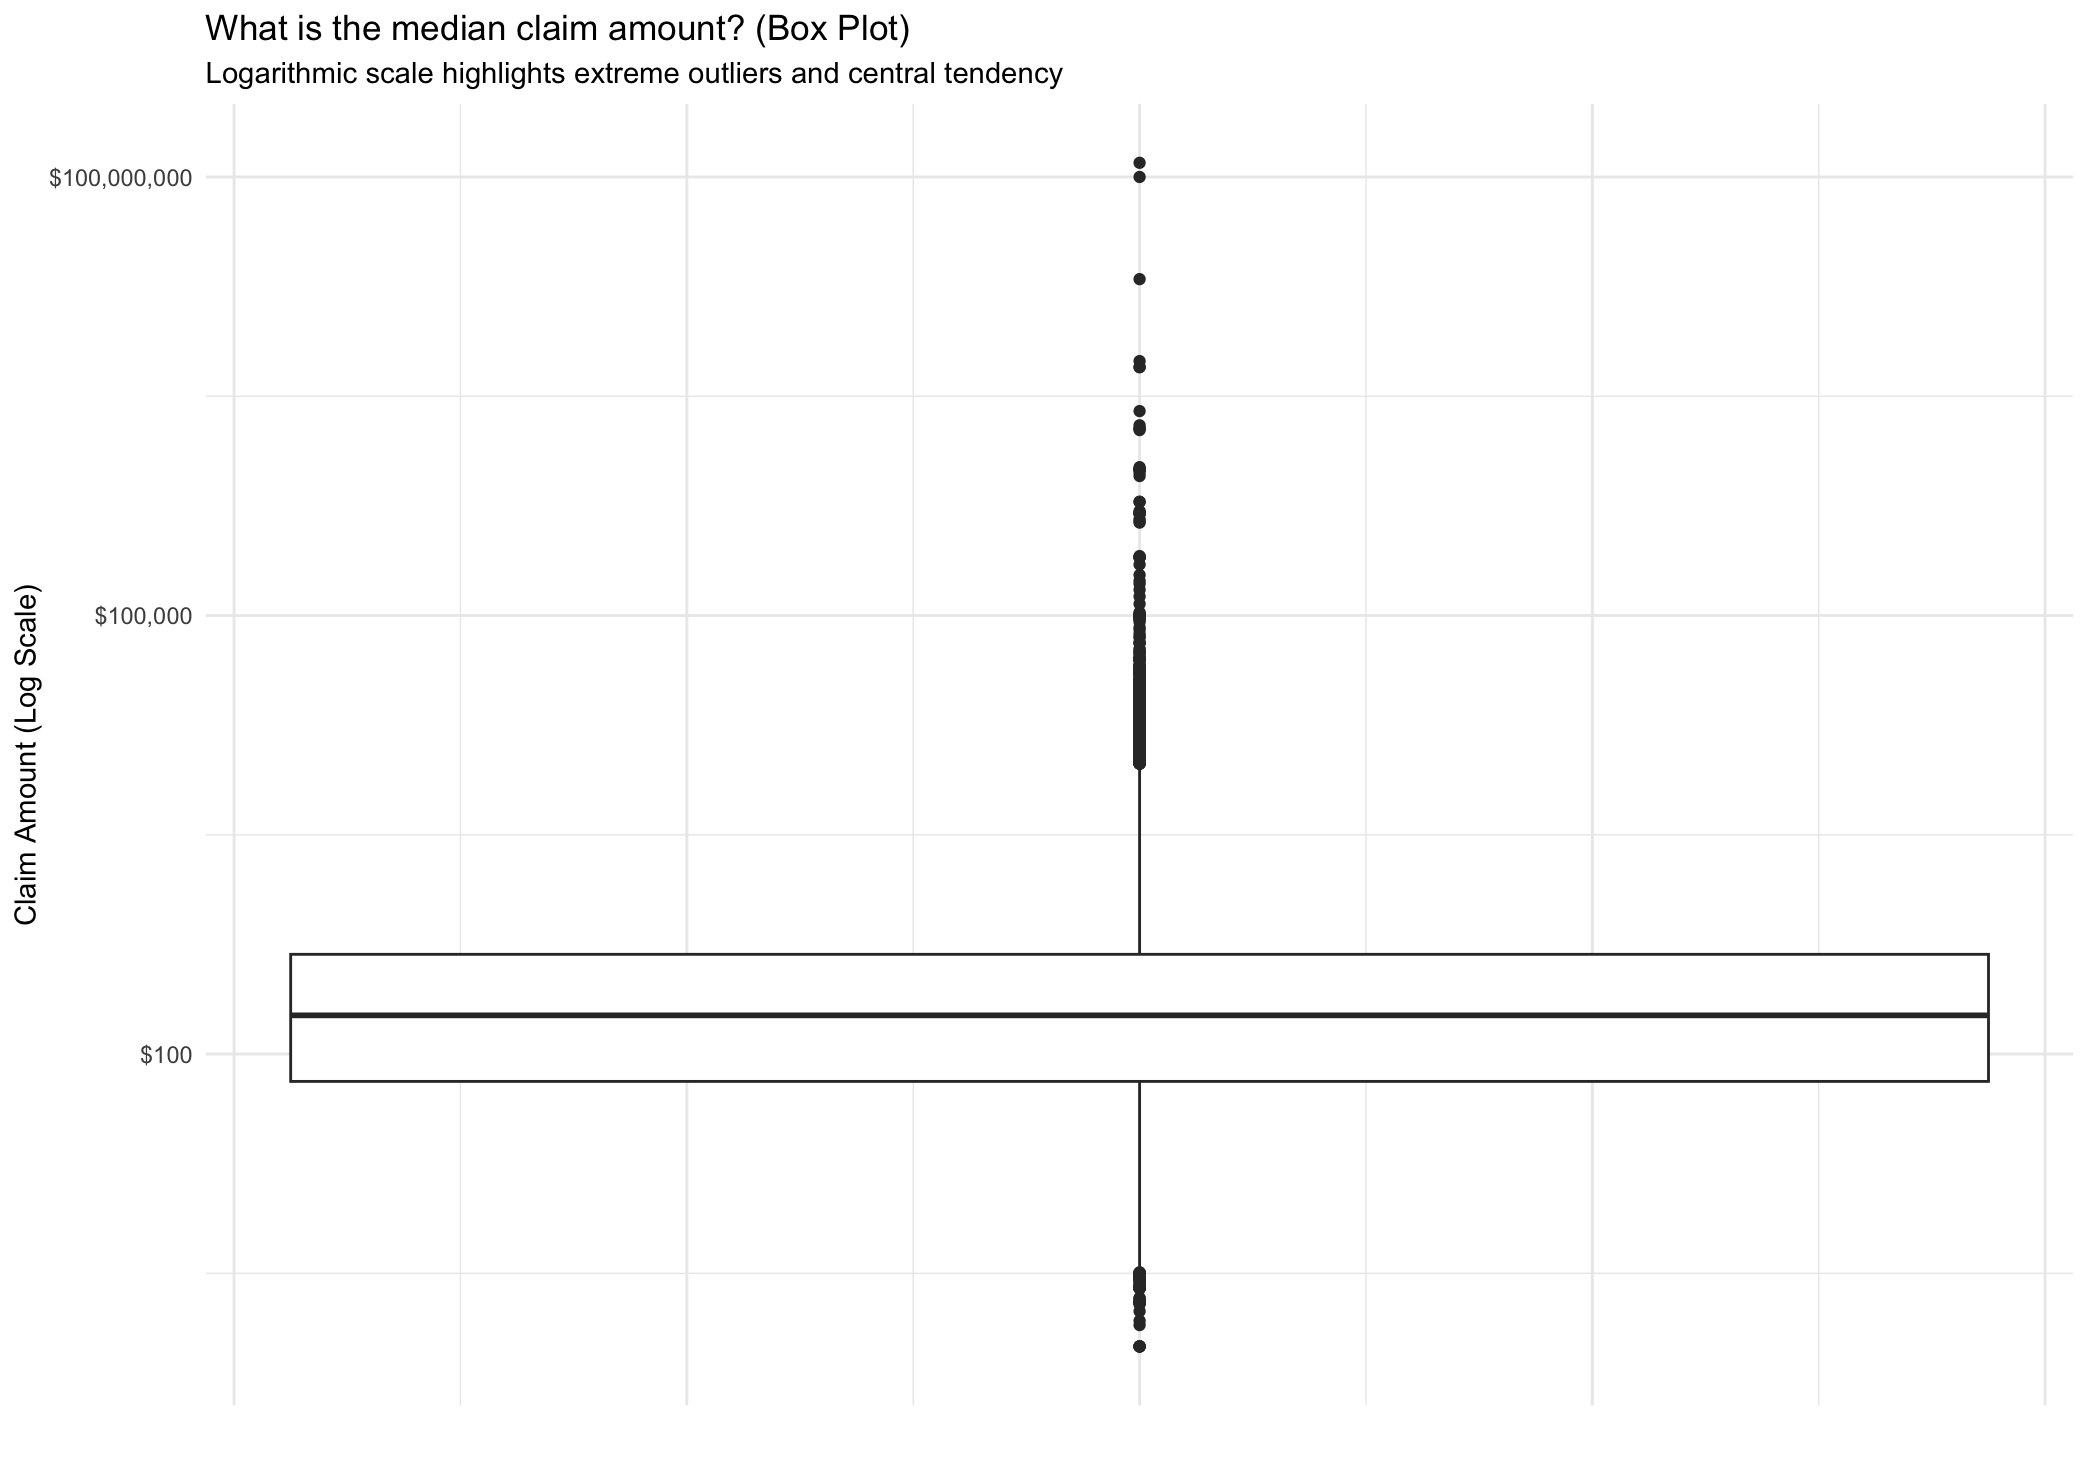
- Handle skew. Use medians and log-scale visualization for extreme claim amounts.
- Explain outcomes. Separate approved, settled, denied, canceled, and pending claims.
Tools & technologies
Data & inputs
The analysis used a TSA claims dataset containing 94,848 records from 2002 through 2025. Fields included claim type, incident site, claim amount, and case disposition.
Results
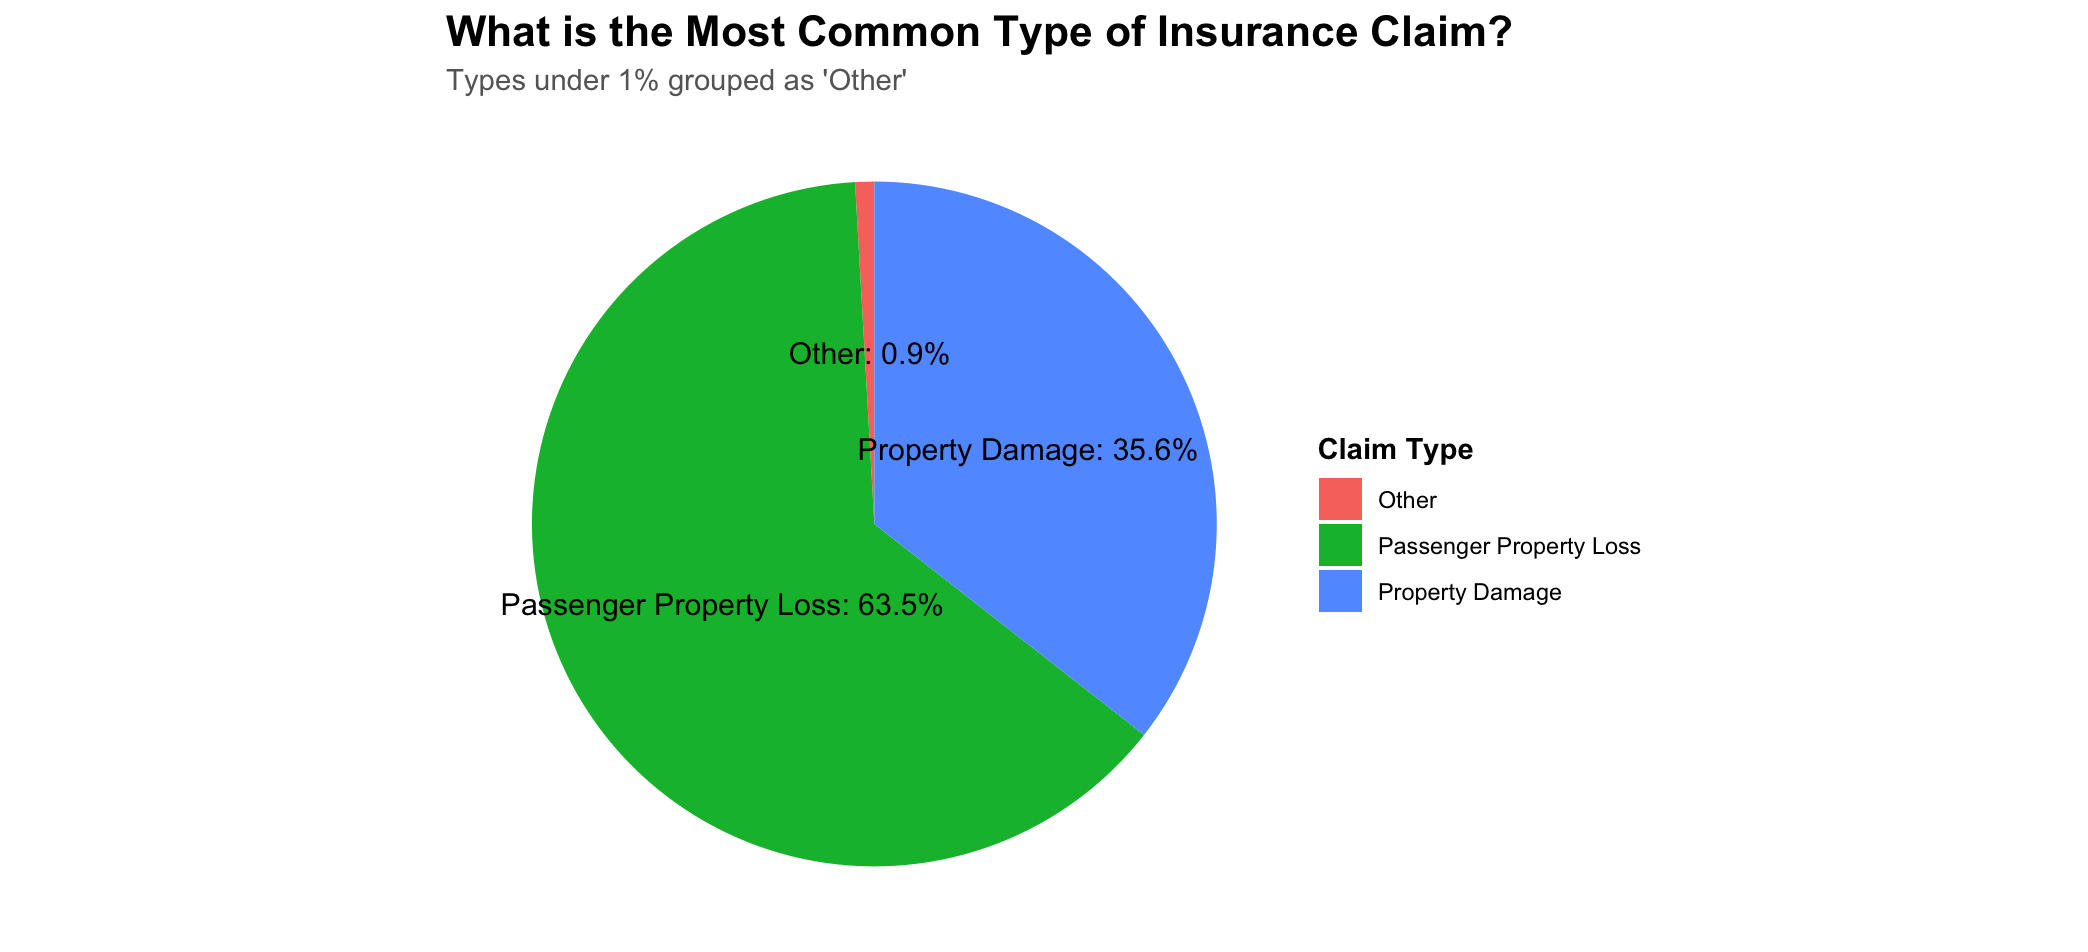
- Passenger Property Loss represented 63.5% of claims.
- Checked Baggage was the most common incident site, with 80,553 records.
- The detailed report calculated a median claim amount of $184 despite extreme outliers.
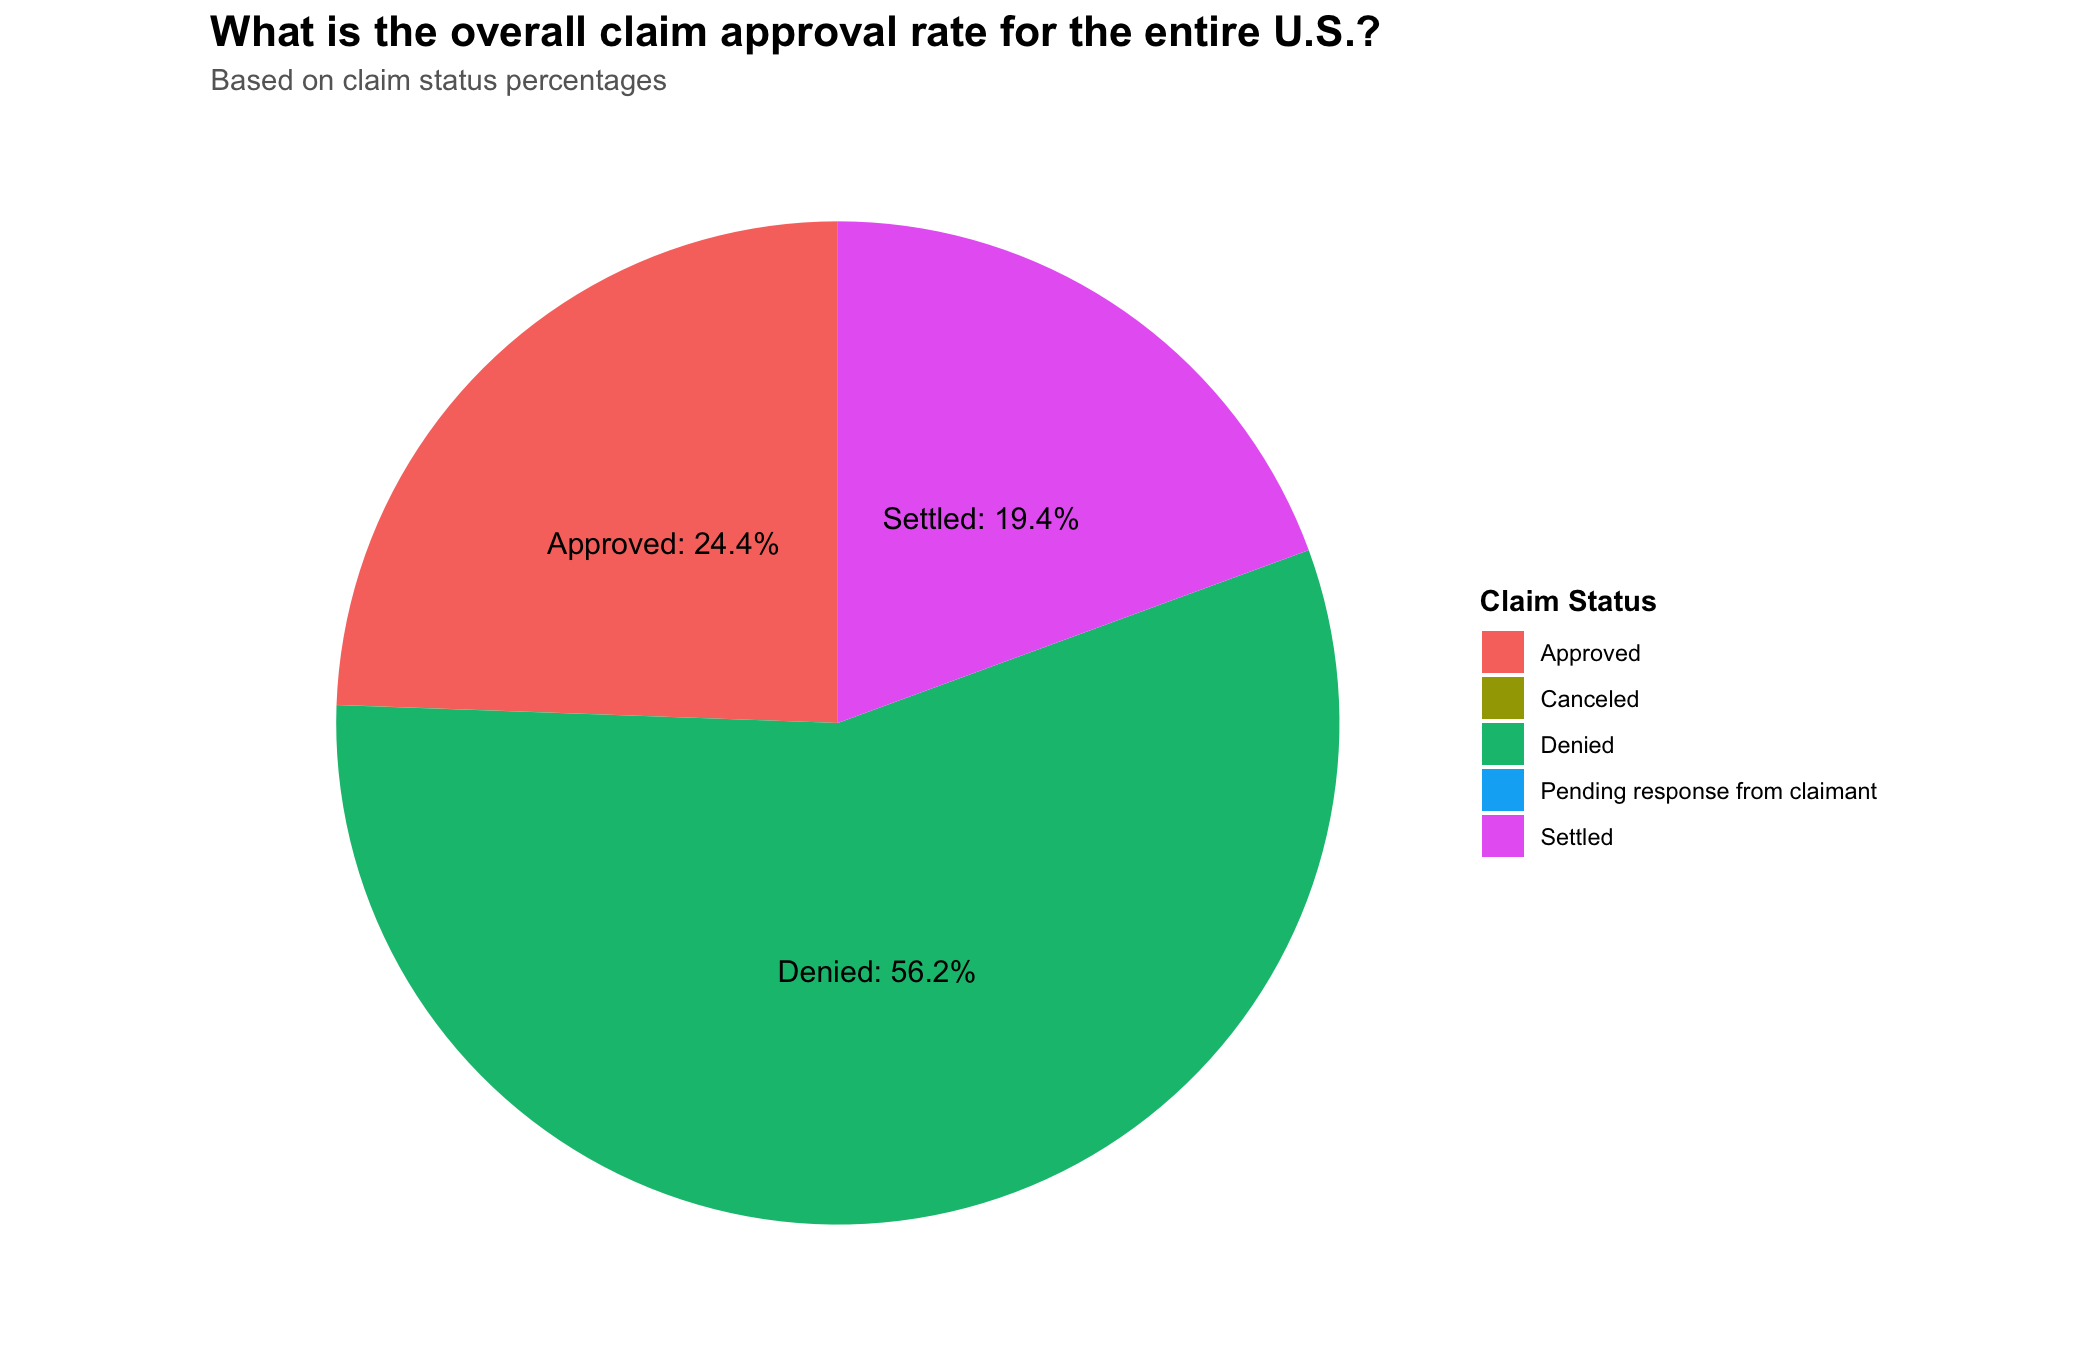
- 24.4% of claims were approved and 19.4% were settled, for 43.8% receiving some reimbursement.
Technical challenges
- Extremely large claim values distorted ordinary scales and averages.
- Outcome categories required careful separation before calculating rates.
- Claim type and site labels needed consistent grouping.
- Visuals had to communicate national patterns without implying causes.
Limitations
The analysis is descriptive. It does not estimate causal relationships, account for passenger volume by airport, or determine whether approval patterns reflect claim quality, policy, reporting behavior, or other operational factors.
Future improvements
- Normalize claims by airport passenger volume where reliable data are available.
- Analyze outcomes over time and by airport.
- Document a reproducible cleaning dictionary for category decisions.
- Investigate missingness and inflation-adjusted claim values.