
Data Analyst AI & Automation Enterprise Systems

Turning complex data into reliable, human-centered systems.

I build data-driven tools and workflows that turn complex operational information into useful, reliable systems. My work spans Python, R, GIS, enterprise data quality, automation, and applied AI, with a focus on human-centered and accessible technology.

  • Python
  • R
  • SQL
  • GIS
  • Applied AI
  • Data Quality
Illustrated portrait of Crystal Hollis
120+ TBmedia data analyzed
68 locationsgeocoded with Python

Selected work

Browse all projects
Reviewed intakeMetadata
Wizard
QC-ready
output
  • Python
  • Tkinter
  • OpenAI Vision
  • ExifTool
  • Accessibility

AI-Assisted Metadata Wizard

Human-in-the-loop desktop automation for media metadata, accessibility alt text, and controlled-vocabulary review.

Problem
Manual metadata entry was repetitive, while AI-generated descriptions still required professional review.
Solution
Combined reviewed intake parsing, XMP/IPTC writes, alt-text drafts, and keyword QC in one application.
Result
An operational, human-reviewed workflow supporting a documented summer backlog of 2,628 files.
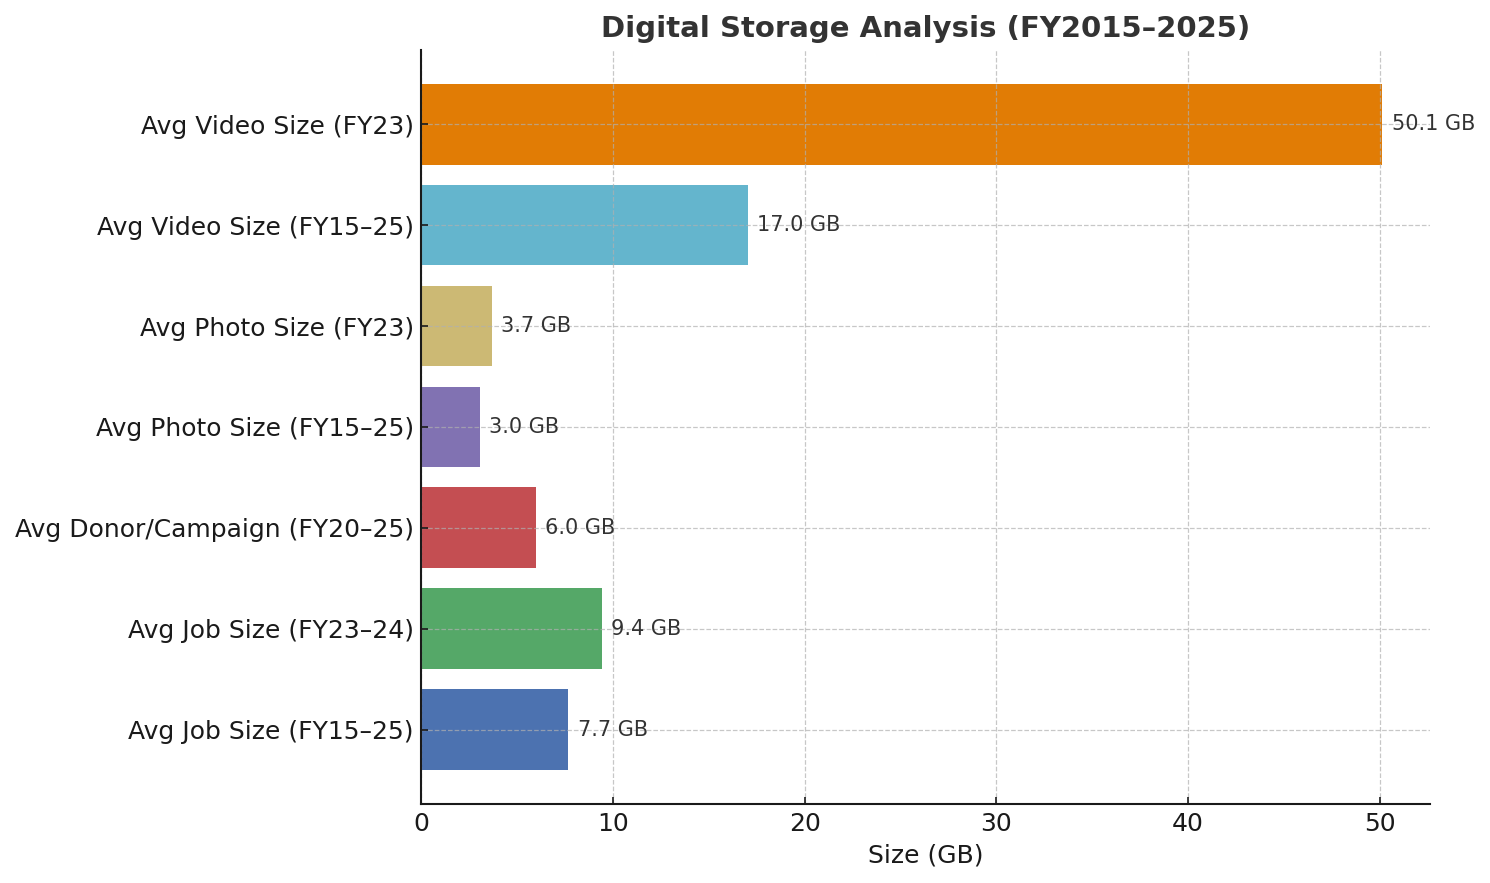
Storage analysis output summarizing folders and file sizes
  • Python
  • pandas
  • Excel
  • Data Quality

Enterprise Media Storage Analysis

A filesystem analysis pipeline built to make decentralized institutional storage measurable.

Problem
Storage records were distributed across directories and operational systems.
Solution
Scanned directories, reconciled job records, and produced structured analysis.
Scale
302,933 folders and more than 120 TB reviewed.
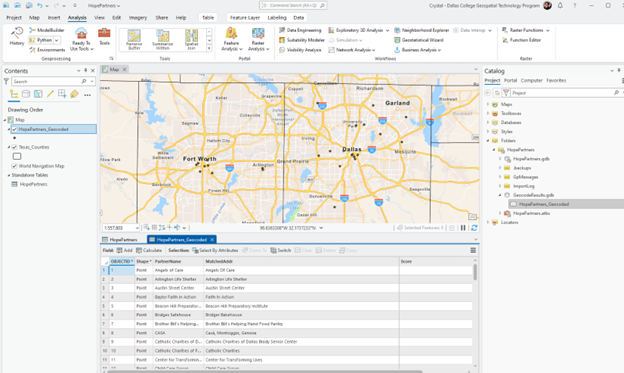
ArcGIS Pro map showing geocoded Hope Supply Co. partner locations in North Texas
  • Python
  • ArcPy
  • ArcGIS Pro
  • pandas

Hope Supply Geocoding Pipeline

An interactive Python workflow that converts incomplete organization records into mapping-ready spatial data.

Problem
Partner records lacked full addresses and coordinates.
Solution
Automated ingestion, geocoding, field creation, and low-confidence review.
Result
68 partner locations prepared for mapping.
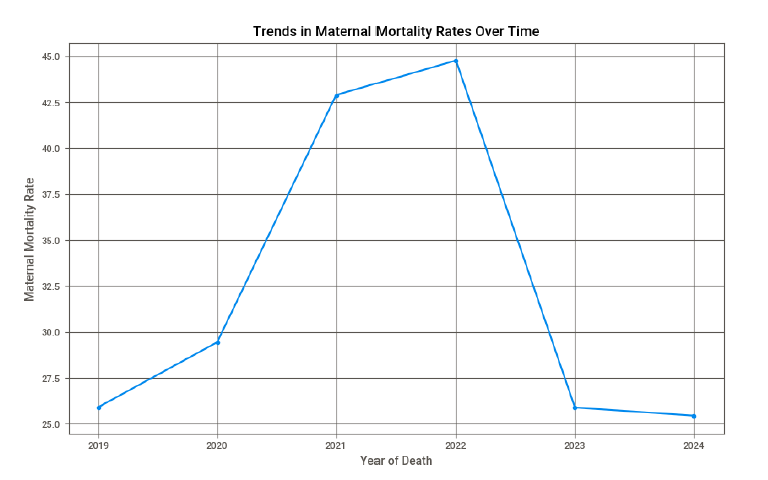
Line chart showing U.S. maternal mortality rates across 12-month-ending estimates
  • Python
  • pandas
  • Public Health
  • Reproducibility

U.S. Maternal Mortality Trends & Demographic Disparities

A post-class revision that turns a maternal-health research paper and supporting ML experiment into a defensible descriptive surveillance analysis.

Question
What trends and demographic differences can the CDC/NCHS snapshot support?
Approach
Quality flags, separate demographic analyses, rolling-window visualization, and June endpoint comparisons.
Revision
Target leakage identified, predictive claims removed, and AI assistance disclosed.
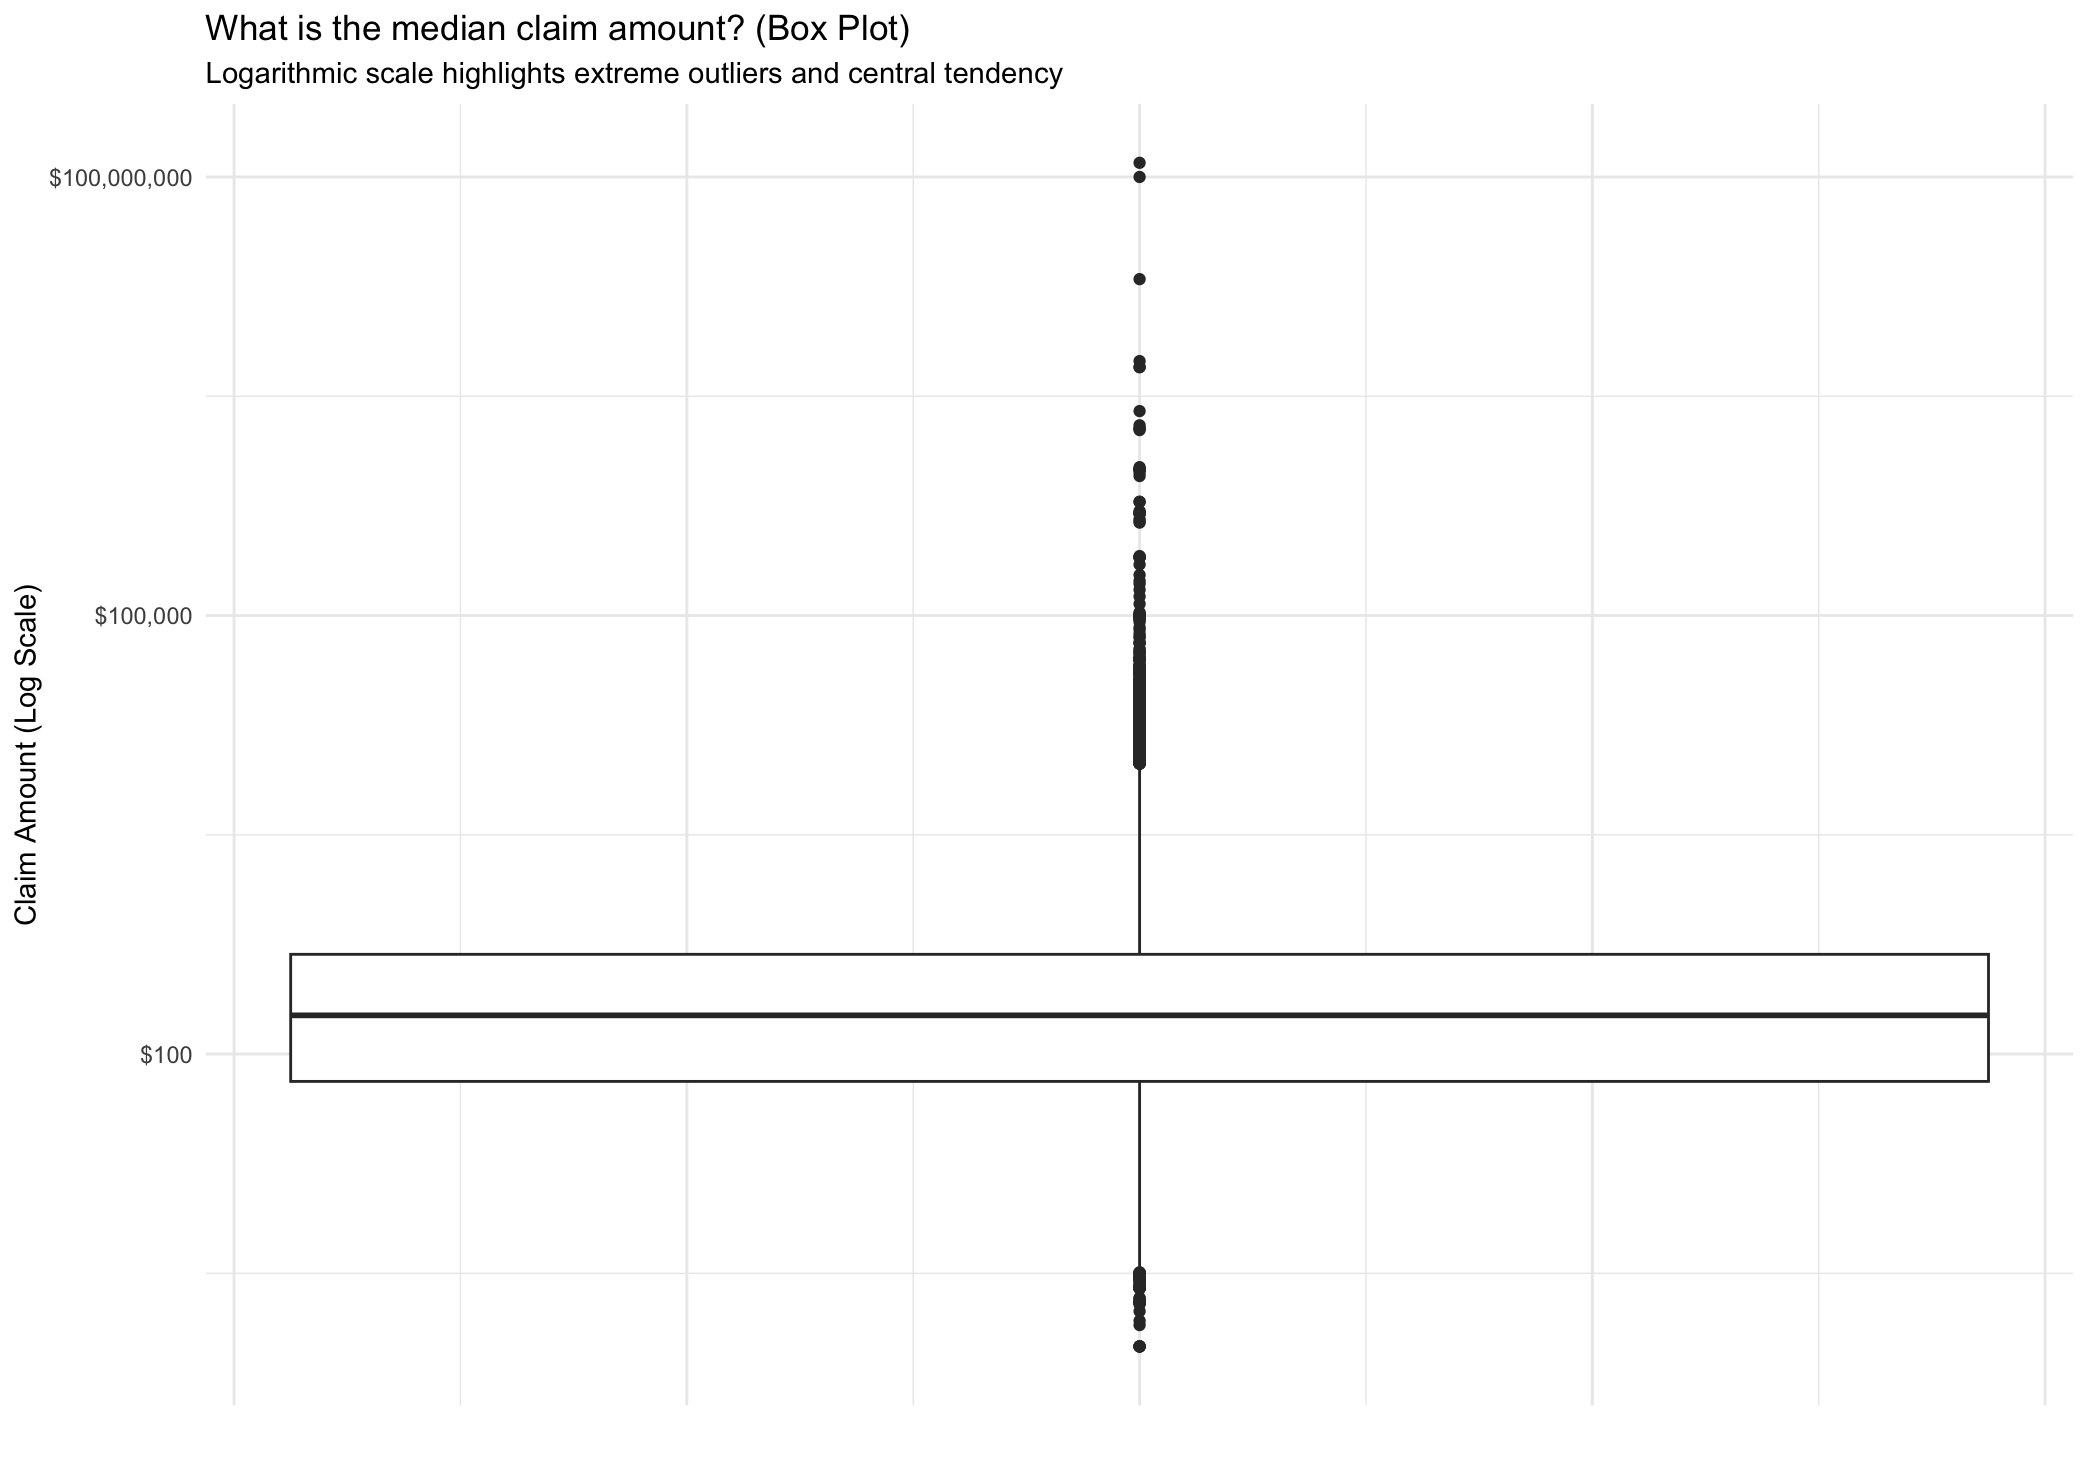
Bar chart showing outcomes for TSA claims
  • R
  • EDA
  • Data Cleaning
  • Visualization

TSA Claims Analysis with R

Exploratory analysis of U.S. airport claims, their locations, outcomes, and highly skewed values.

Problem
Messy public claims data made national patterns difficult to interpret.
Solution
Cleaned, summarized, and visualized claim types, sites, amounts, and outcomes.
Finding
24.4% of claims were approved across 94,848 records.

Professional context

Technical work shaped by real operations.

My background spans academic data operations, institutional media systems, automation, and client-facing production. That context keeps my technical work grounded in quality, documentation, accessibility, and the people who use the system.

View experience

Let’s connect

Interested in thoughtful data work?

I am open to data analysis, automation, enterprise-systems, GIS, and applied-AI opportunities, as well as graduate research conversations.